Latest Blogs
See More


Indian Dairy News


DairyNews7x7
Global Dairy News


DairyNews7x7

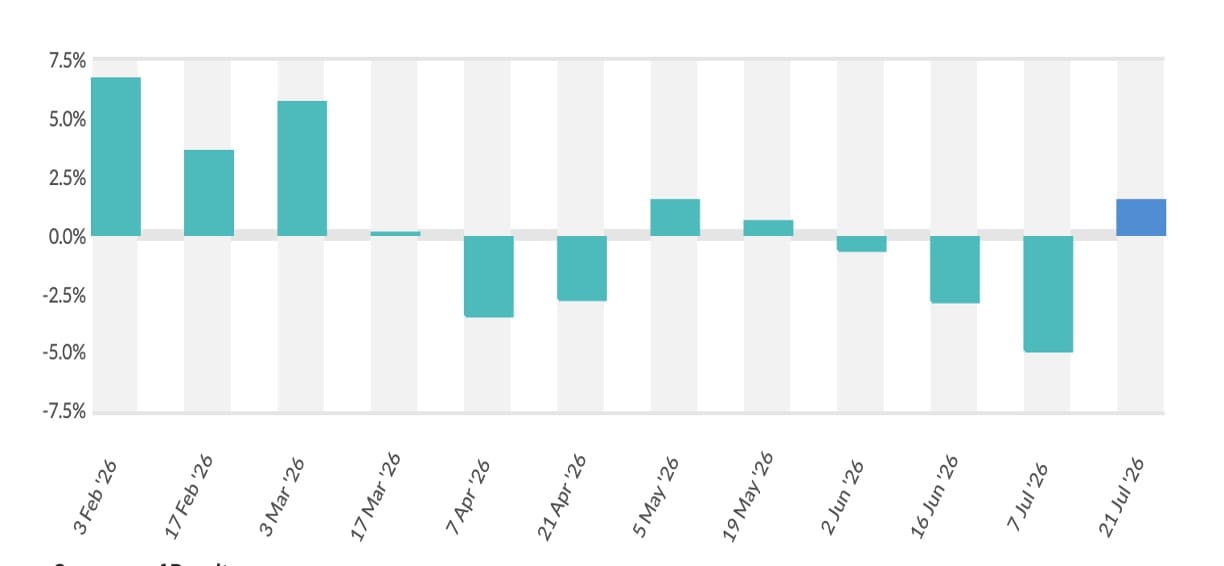
After moderating in the previous three months, inflation rate based on the Consumer Price Index (CPI) for January surpassed the upper threshold of the Reserve Bank of India’s tolerance band. The increase in retail inflation from 5.7 per cent in December to 6.5 per cent in January was largely driven by food prices, particularly cereals. Inflation in cereals hit 16.1 per cent in January. Alongside, prices of protein-rich items such as milk eggs and meat led to food inflation soaring from 4.58 per cent to 6.19 per cent.
Core inflation continues to remain persistent at 6.2 per cent. Last week, the RBI’s Monetary Policy Committee had signaled that more rate hikes may be needed to break the persistence of core inflation. With the surge in January CPI inflation, the RBI’s forecast of 5.7 per cent for the January-March quarter could face an upside risk.
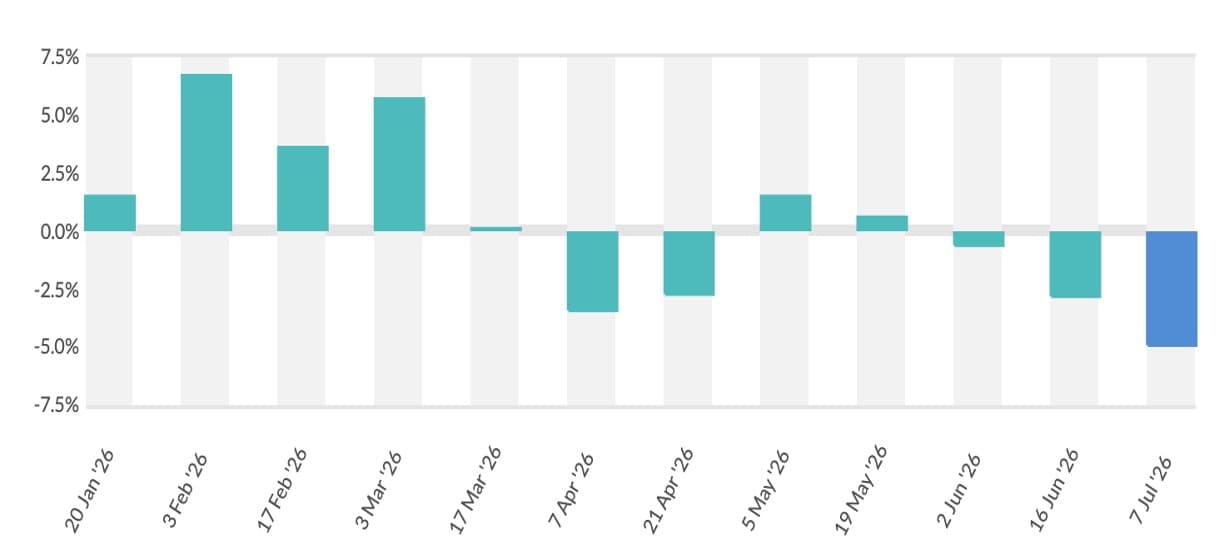
In contrast, the Wholesale Price Index (WPI) based inflation fell to a two-year low of 4.73 per cent in January. This is the fourth consecutive month of WPI inflation remaining in single digits, after 18 consecutive months of double-digit inflation. The decline in inflation was primarily driven by softening of prices in fuel and manufactured products. Inflation in manufactured products which constitute more than 64 per cent of the WPI basket, moderated from 3.37 per cent in December to 2.99 per cent in January.
Inflation in food articles saw an increase from -1.25 per cent in December to 2.38 per cent in January. Rise in food prices will have a relatively greater impact on CPI than the WPI because of the weights. Food has an overall weightage of roughly 25 per cent in the WPI basket while in the CPI basket, food occupies a weightage of 46 per cent.

Since the two indices capture prices at different stages, their composition varies. The basket of items and their weightages in the CPI series are derived on the basis of average monthly consumer expenditure of an Indian household obtained from the Consumer Expenditure Survey (CES). The CES is traditionally a quinquennial (recurring every five years) survey conducted by the government’s National Sample Survey Office (NSSO). The survey is designed to collect information on the consumer spending patterns of households across the country, both urban and rural. Currently, the basket is based on the 68th round of the CES with reference period of July 2011 to June 2012.
The CSO prepares the CPI basket of items and their weightages using the Modified Mixed Reference Period (MMRP). Under this method, for food items and certain other items, data on expenditures incurred are collected during the last seven days. For durable goods, clothing, and footwear, data on expenditure incurred are collected during the last 365 days. For certain other items such as fuel and light, miscellaneous goods and services, the reference period is 30 days. This method is understood to give a more accurate reflection of consumption patterns.


Between June 2019 and February 2021, wholesale inflation was sluggish and lower than retail inflation. Due to the disruptions caused by the Covid-19 pandemic, production activity remained muted and global crude oil prices plummeted. As economic activity picked up in 2021-22, and global crude oil prices surged higher, WPI based inflation started to rise. In contrast, CPI inflation remained elevated during 2020 owing to supply chain bottlenecks and high food prices.
From March 2021, WPI inflation galloped owing to a lower base and rise in global crude and commodity prices. The trajectory in WPI is influenced by movements in the global crude oil prices. The two series have a strong correlation of almost 0.8.
Source : The Print Feb 17th 2023, Radhika Pandey is Senior Fellow at National Institute of Public Finance and Policy.